- What an Operating Model is
- The first steps in designing an Operating Model
- How those steps were applied to a real business
- Using the Operating Model to determine ROI on core sales positions
- How to use the Operating Model to create clarity, delegate responsibility, and define scorecards
- Using an Operating Model to predict staffing needs
- When to use an Operating Model to diagnose problems
- How to use an Operating Model to motivate employees to get results
The most important thing that a leader of a business can do is to decide what to work on. An Operating Model is one of the most effective tools we have to make those decisions.
This is sometimes referred to as Demand Planning, other times as Sales and Operations Planning (S&OP). But at its most basic, an Operating Model is a forecasting tool that can compare projected numbers against actual numbers in order to realign your strategy.
What Is S&OP?
S&OP is a process that helps a company align its various functions while balancing supply and demand.
As explained by SmartSheet.com:
At its best, S&OP offers distinct benefits that old-school business plans can’t achieve:
- Better data and collaboration between departments allow for frequent adjustments in the supply chain, which better balances supply and demand.
- Companies can better optimize resources, which reduces waste and increases efficiency.
- In turn, this newfound efficiency enables companies to maximize their profitability continuously.
- Improved inventory and backlog management allows for more timely customer service.
- As companies stagnate, S&OP can fuel a resurgence by finding ways to adjust to changing internal or external conditions.
- Unbiased, more actionable data can lead to better Key Performance Indicators (KPIs) for each department, tying in directly with the company’s KPIs.
- As data flows more seamlessly between departments, it is more timely and accurate – this allows the company to operate off one set of numbers rather than siloed, disputable data. You may hear people in the field refer to “one set of numbers to run the business.”
The term S&OP is often used interchangeably with Operating Model or Demand Planning.
Supply Vs Demand

One of the central issues of The Operating Model is the question of demand and supply. We begin the process by identifying how much demand exists in the market. We then use that information to plan out how we will meet that demand, more commonly known as “supply.”
Supply encompasses all products and services. It also encompasses the people necessary to bring those products and services to the customer.
So, if you’re an HVAC company, you must determine how much potential demand there is in your market. Then you can start to plan how many people you need to hire, how much equipment you need to buy, and how much you should invest in your marketing efforts.
The first step is identifying how much demand exists. That means looking at a lot of revenue statements.
Answering The Demand Question
If you’re preparing to buy a company, the first thing you need to do is look at how revenue comes into the business.
In order to evaluate a revenue source, you need to look at the sales funnel from a top-down perspective and calculate each conversion point in the business.
The best way to accomplish this calculation when buying a business is to interview the seller or a key employee. Then go through the existing sales funnel and its conversion points together. Be systematic and thorough in your approach. After all, excellent outcomes are born from strong systems. Begin with the following steps:
1. Identify the current revenue sources. List each of them as well as the average amount of revenue and gross profit for each successful sale.
2. Identify the marketing channels for each source, and each of the sales conversions within the funnel.
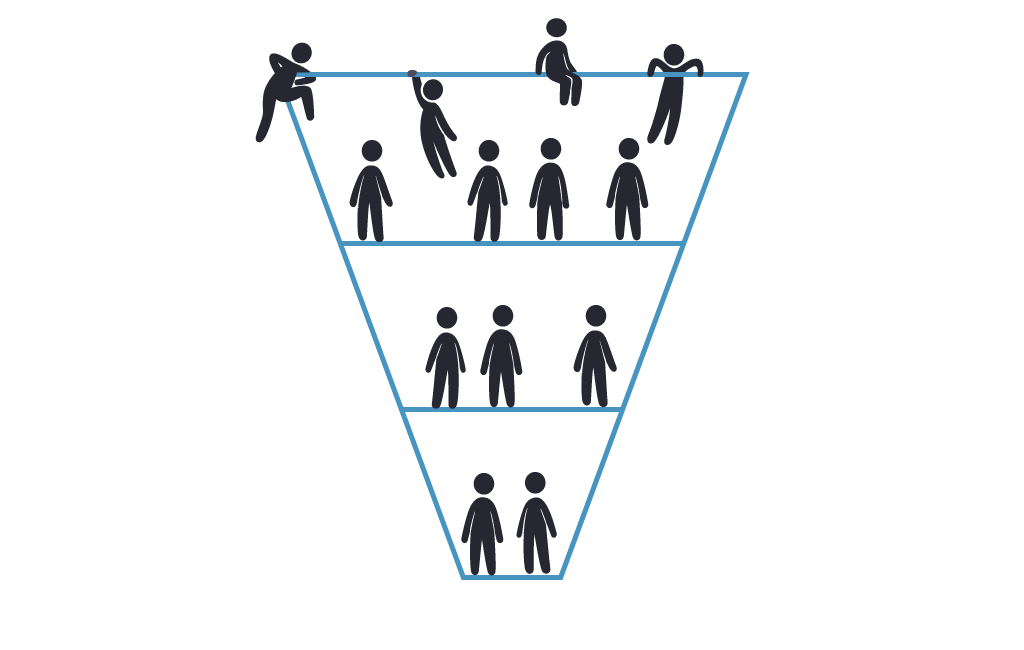
3. Include the cost of traffic (ie: the clicks to generate a sale), and the gross profit to see if this will be a profitable tactic at scale.
To see how we can apply these numbers, let’s look at an example close to home.
Identifying Revenue Sources: A Case Study In Residential HVAC
In the residential HVAC service business there are a number of revenue streams:
- Changeouts – Each house needs a new furnace/AC unit every 12 years, on average. With some optimization, the average revenue should be around $7000-9000 depending on the local market, and the gross profit margin should be around 50%.
- Maintenance Contracts – Can be sold to 100% of houses because they extend the life of the furnace/AC unit and act as preventative maintenance. This is annually recurring revenue targeting a 40-50% gross profit margin.
- Service – This is when the new furnace/AC needs to be repaired. Typically a dispatch fee comes in at $89, and then service is dependant on the time and material required (targeting a 50% gross profit margin).
Then you should turn your attention to the Total Addressable Market (TAM) to determine how many opportunities exist. For example, how many homes are within 50 miles of the company? Once you have that number, you can see how much potential business there is for the company.
Answering The Supply Question
We’ve identified the chief revenue sources for the company and the gross profit for each. We also have an idea of the Total Addressable Market. This answers the important question of demand.
Next, we need to turn our attention to the question of Supply.
The trick here is taking the information we gathered and creating a tool that we can look at to create goals and measure success. This tool is what we call an Operating Model.
In an effective Operating Model, each aspect of the sales funnel will become a row on a spreadsheet that is tracked over time. Through tracking these aspects, the company is able to create goals and expectations. A person is put in charge of each line on the spreadsheet, creating accountability and ownership within the organization.
An Operating Model Illustrated
In order to illustrate this, we’ve created a basic Operating Model for an average residential HVAC company. You can see it here. Make sure you copy it to your own Google Drive before you start working with it.
To keep things simple, let’s first look at the number of phone calls the company receives:

You’ll notice that we are projecting to receive 100 phone calls during the first week, 103 during the second week, and the numbers rise from there. It’s important to go back and fill in the actual numbers when we receive the real data:

Updating the information with real numbers allows us to refine our predictions over time.
As noted under the “Function” column, phone calls are under the purview of the marketing department. But how do we control how many phone calls the company receives? That might seem impossible, but what it ultimately comes down to is how much we’re investing into the marketing department each week. To see that number, we must look higher in the sales funnel:
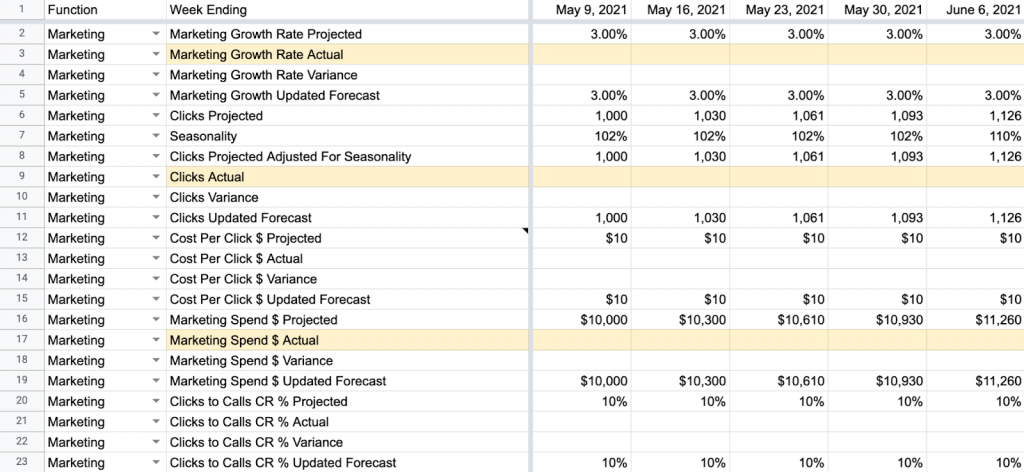
What you’re seeing in the image above is based solely on predictions. These predictions are created through the market research you did earlier in the process. Let’s see what it looks like as we start inputting real information:
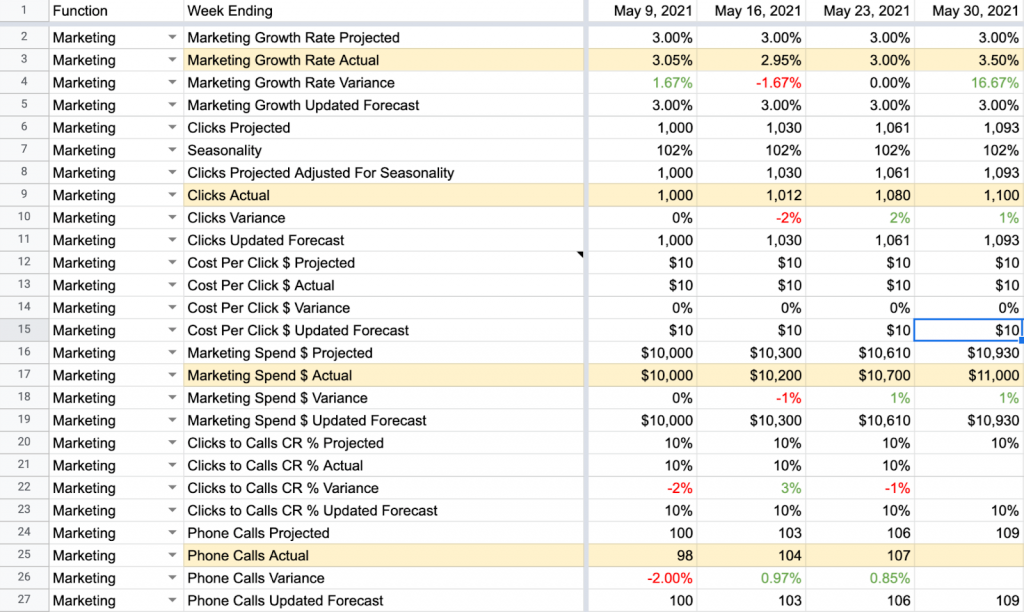
You’ll notice that, as each yellow line is filled out with real information, the predictions lower down the Operating Model are changed.
The next stage of the funnel is the sales department. Based on how much money we invested in marketing, we were able to accurately predict how many clicks we would receive through our online advertisements. That number corresponded directly to how many calls we received each week. That, in turn, corresponds to our Booking Rate:
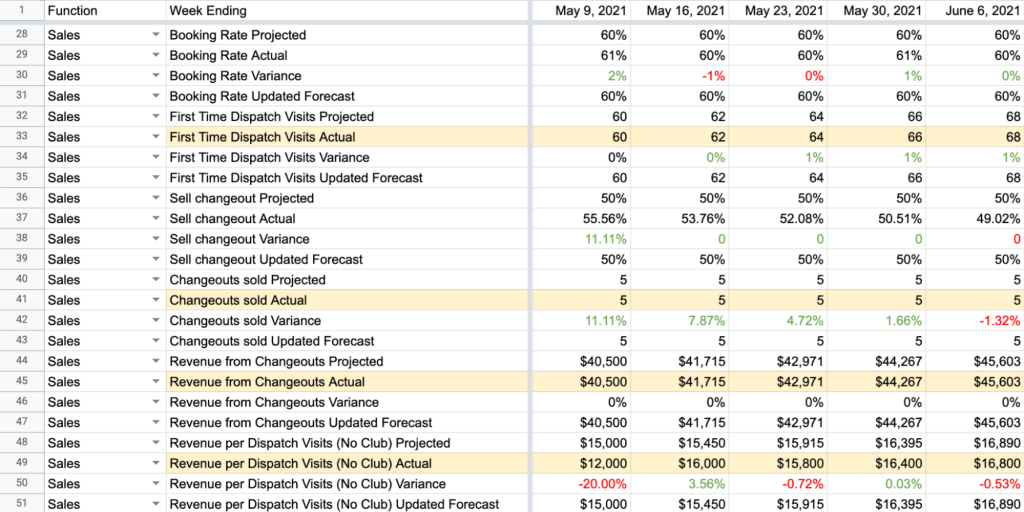
The booking rate impacts how many times we send someone out to a home for the first time (First Time Dispatch Visit), from which we can generally surmise–through industry averages–how many changeouts will be needed. This gives us a prediction of revenue moving forward.
Again, it is very important to go back and update the numbers once you receive the real-life data. Then, you use that information to improve your forecasts.
The Operation Model As Forecasting Tool
It’s at this point in the Operating Model that the General Manager can use the information to predict staffing, fleet, and equipment requirements:

As you can see from the diagram above, if we were to receive that many clicks and calls through our marketing department, which led to a specific number of first-time dispatch visits, which in turn led to a certain amount of changeouts, we would need four ServiceTechnicians to handle that workload. Furthermore, we would need at least one Installer, one Install Assistant, and five trucks. In the office, we would need two CSR/dispatchers, one Service Manager, one Install Manager, and one Sales Manager.
If we jump ahead a few weeks, assuming all of our own projections are exactly right (which, in real life, they never will be), you can see how the Operating Model tells us how many new hires will be necessary:
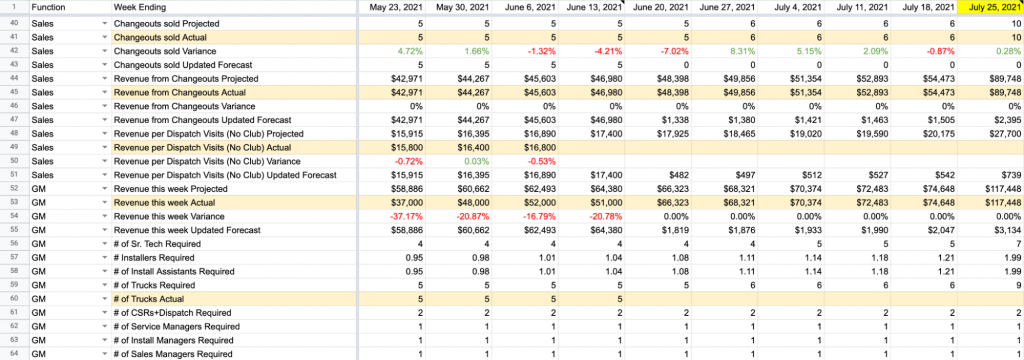
By July 25, 2021–less than three months after we started–we’ll need to have a total of seven Service Technicians and two Installers to handle the workload. Moreover, we’ll need nine trucks. That’s a heavy investment, but luckily our Operating Model also allows us to predict how much revenue we’ll have coming in. Thanks to that, we can know if we can afford this growth.
Hiring three additional service technicians and one additional installer will take 45-60 days. Before we do that, we need to buy trucks, wrap them, set them up with shelving and inventory – a process that will also take at least 30 days. This means we need to make these decisions at least 90 days ahead of time, hence the need for a forecasting tool.
Download the spreadsheet yourself and play around with the numbers. That will help you understand the process even better, but the point is to illustrate that these Operating Models serve as an accurate record of what the business has accomplished as well as a forecast of what you will need in order to meet growing demand.
Creating A Dashboard

With the information collected above, a person from the organization is placed in charge of each section of the spreadsheet. Oftentimes, an individual role will be in charge of one specific line on the spreadsheet.
That information is then used to create a Dashboard (sometimes referred to as a scorecard). The numbers on a Dashboard should be weekly activity-based numbers such as those listed in the Operating Model above.
These will become measurements for certain roles. For example, the changeout conversion might be an important KPI for the sales manager, the booking rate might be a KPI for the Customer Service Representative (CSR), and the traffic staying under a certain cost is a key metric for digital marketing.
Conclusion
An effective Operating Model is a powerful tool for a new business owner. It not only allows you to create a roadmap for how you want to change a business but allows you to measure the effectiveness of your methods.
If you want to learn more about how to create your own Operating Model and apply it to your specific business, we recommend checking out our Acceleration Gauntlet. If you’ve already taken our Gauntlet, schedule a call with us to discuss your next steps.
Have you had any setbacks trying to transform a business? Or any other endeavor? We’d love to hear about it in the comments below! And if you found this article useful, please feel free to share it with people you think might find it useful too.
Key Takeaways
- An Operating Model is how we turn strategy into action.
- Creating an Operating Model should always begin by looking at a company’s revenue sources.
- Identify the biggest sources of revenue and their gross profit margins.
- Use that information to create a sales funnel.
- Using the new Operating Model to determine where to make investments and how to track your ROI.
- How to use the new Operating Model to delegate responsibilities to people within your organization.
Acquira specializes in seamless business succession and acquisition. We guide entrepreneurs in acquiring businesses and investing in their growth and success. Our focus is on creating a lasting, positive impact for owners, employees, and the community through each transition.


